


Histone Propionylation Analysis Service
Based on a high-resolution liquid chromatography-tandem mass spectrometry (LC-MS/MS) platform, MtoZ Biolabs' histone propionylation analysis service provides precise detection and quantitative analysis of histone propionylation modifications. This service can identify propionylation modifications on histone lysine residues and analyze their abundance changes under different experimental conditions. By integrating bioinformatics methods, it provides data on modification site distribution, abundance changes, and functional annotations, offering data support for researchers to explore Kprop modifications in relevant fields.
Overview
Histone propionylation (Kprop) refers to a post-translational modification in which a propionyl group is attached to histone lysine residues. It plays a crucial role in regulating chromatin structure and gene expression. Kprop modifications are closely related to cell metabolism, epigenetic regulation, and cellular responses, especially in energy metabolism, gene transcription regulation, and cell differentiation. This service can identify propionylation modifications on various lysine residues and conduct a comprehensive analysis of both the modification and its reverse effects. It is widely applied in epigenetics, metabolic regulation, and cellular function research, helping to deepen the understanding of Kprop's role in cell biology.
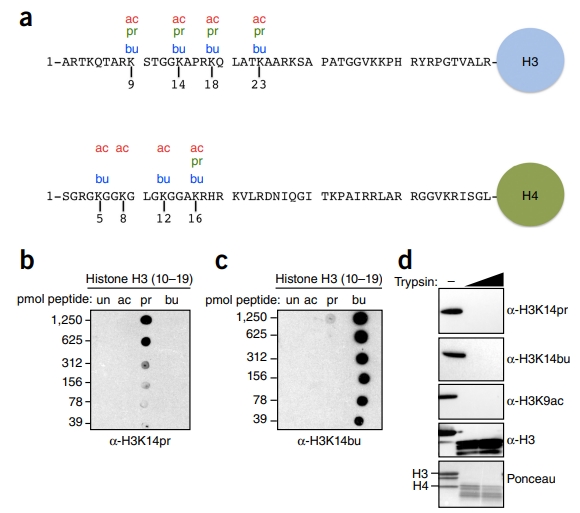
Kebede, A F. et al. Nature Structural & Molecular Biology, 2017.
Figure 1. Histone Lysine Propionylation and Butyrylation Sites.
Analysis Workflow
Histones are extracted from experimental samples to ensure the integrity and stability of modifications.
2. Peptide Enrichment and Digestion
Optimized digestion conditions are applied, and specific enrichment methods are used to capture propionylation-modified peptides.
3. LC-MS/MS Analysis
High-resolution liquid chromatography-tandem mass spectrometry (LC-MS/MS) platforms are utilized to perform site identification and quantitative analysis.
4. Data Analysis
Bioinformatics tools are used to analyze modification site distribution, abundance changes, and functional correlations, providing a comprehensive data report.
Sample Submission Suggestions
1. Sample Type and Quantity
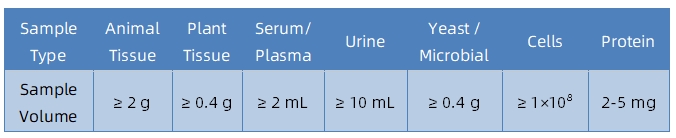
Note: Plasma should be collected using EDTA as an anticoagulant. Standard tissue or cell lysis buffers can be used during protein extraction.
2. Sample Transportation
Note: For special samples or if a detailed submission plan is required, please contact MtoZ Biolabs technical staff in advance.
Service Advantages
1. High Sensitivity Detection
Using the LC-MS/MS platform, propionylation modifications at low abundance are accurately identified, ensuring high detection sensitivity.
2. One-Time-Charge
Our pricing is transparent, no hidden fees or additional costs.
3. Strict Quality Control
End-to-end quality control ensures the stability, accuracy, and reproducibility of experimental results.
4. Customized Service
Experimental plans are flexibly adjusted based on research objectives and sample types to meet diverse needs.
Applications
1. Epigenetics Research
Histone propionylation analysis service can be used to analyze the role of propionylation modifications in chromatin structure and gene transcription regulation.
2. Stress Response Research
By analyzing propionylation modifications, their regulatory role in cellular stress responses and environmental adaptation can be studied.
3. Immune Regulation Research
Histone propionylation analysis service can be used to study the regulatory role of propionylation modifications in immune cell function and immune responses.
4. Potential Biomarker Discovery
By identifying modification patterns associated with specific physiological or pathological states, this service aids in the screening of novel biomarkers.
Deliverables
1. Comprehensive Experimental Details (Materials, Instruments, and Methods, etc.)
2. Relevant Liquid Chromatography and Mass Spectrometry Parameters
3. Detailed Information on Histone Propionylation Analysis
4. Raw Data
5. Mass Spectrometry Image
6. Custom Analysis Report